WDT Windows Diagnostics Toolkit

PS C:\WDT> .\Invoke-WindowsDiagnostics.ps1

One read-only pass. One diagnostic report.

Collect the Windows state and recent failure context needed for initial troubleshooting across system, performance, network, security, storage, services and updates.

Built for system administrators and support engineers who need consistent evidence before changing the system.

READ-ONLY · LOCAL REPORTS · NO AGENT · PS 5.1 / 7+ · WINDOWS 10 / 11

Report excerpt SAMPLE DATA

PS>.\Invoke-WindowsDiagnostics.ps1 -All -PrivacyMode

[WARN]SecurityBitLocker volume not protected

[WARN]TimeLocal clock source reported

[WARN]ServicesOne or more services need attention

[OK]NetworkNo findings

--0 errors · 3 warnings · 7 OK modules

>.\WindowsDiagnosticsReport-20260712-101530.txt

Findings summary appears before detailed evidence.

Interactive demo Browser simulation

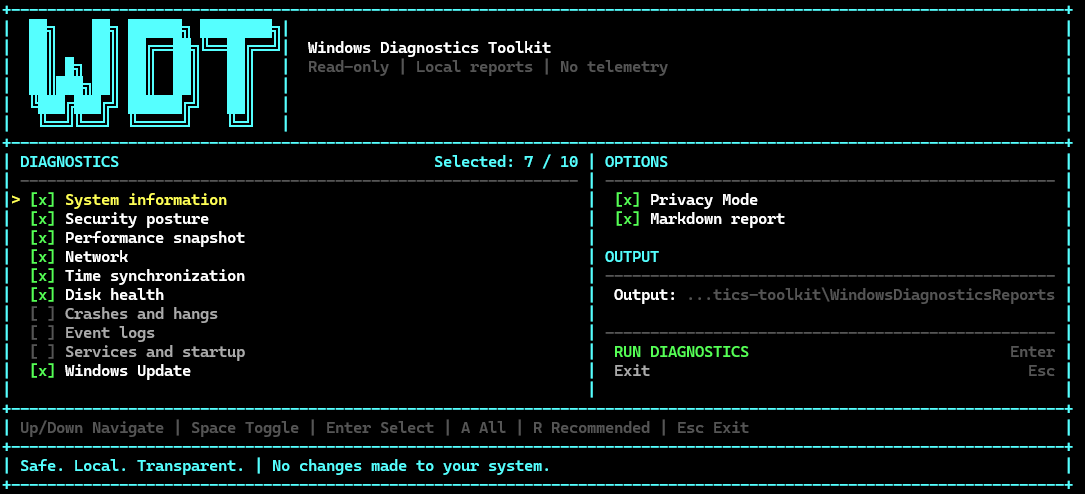
Select the diagnostic modules relevant to the incident.

Preview the current WDT workflow and the structured output produced for a troubleshooting session. This simulation runs only in the browser.

Select modules → Collect locally → Review one report

WDT / interactive dashboard 7 of 10 selectedSystem ready

Select diagnostics

Options

>Output: .\WindowsDiagnosticsReports

Privacy Mode replaces common identifiers. Markdown export adds another format.

Output

[░░░░░░░░░░░░] idle
>Ready.
7 of 10 selected

↑ ↓ navigate · Space / Enter toggleA all · R recommended · Enter on Run

OK — normal · WARN — review recommended · ERROR — collection failed or Windows reported a fault

View real terminal screenshots
Real Windows Diagnostics Toolkit wide terminal dashboard
Real WDT interface · open full-size image
Real Windows Diagnostics Toolkit completed report screen
Real completed run · open full-size image

Command line and automation

Run the same collection without the interactive interface, select only the required modules and write reports to a predictable location.

PS> .\Invoke-WindowsDiagnostics.ps1 -All -PrivacyMode -ExportMarkdown
PS> .\Invoke-WindowsDiagnostics.ps1 -Module System,Network -OutputDirectory .\Reports

No installer, no agent and no third-party modules. Administrator rights are optional. Findings do not change the exit code; a non-zero exit code indicates an execution failure.

View command-line usage →

Quick startv0.1.0-beta

Run WDT.

Verified releaseRECOMMENDED / MANAGED SYSTEMS

Download the tagged release archive and checksum from GitHub, verify SHA-256 and inspect the extracted files before execution.

SHA-256 ee741a450fa20b0903adec858af446806cba74666fde0f98b1bde85dc0188e0f

Release ZIP verified before extraction

One-line bootstrapGITHUB PAGES
PowerShell
PS> irm https://wdt.digital/run.ps1 | iex

[!] Requires trust in run.ps1 served through GitHub Pages. Inspect it first on managed or sensitive systems.

Inspect the bootstrap
PS> irm https://wdt.digital/run.ps1 -OutFile .\wdt-run.ps1
PS> notepad .\wdt-run.ps1
PS> .\wdt-run.ps1
Clone for development
PS> git clone https://github.com/0x0bug/windows-diagnostics-toolkit.git
PS> cd windows-diagnostics-toolkit
PS> .\Invoke-WindowsDiagnostics.ps1
Release integrity
PS> $expected = 'ee741a450fa20b0903adec858af446806cba74666fde0f98b1bde85dc0188e0f'
PS> (Get-FileHash .\windows-diagnostics-toolkit-v0.1.0-beta.zip -Algorithm SHA256).Hash.ToLowerInvariant() -eq $expected

The tagged release binds the archive to a published version. SHA-256 detects whether the downloaded ZIP differs from the expected bytes; it does not establish who produced the file. The ZIP checksum does not authenticate bootstrap code already passed to iex.

Diagnostics10 selectors / 8 groups

Select diagnostic scope.

System

-Module System

Windows version and build, hardware, uptime and core system context.

Establish the machine baseline before deeper analysis.

Performance

-Module Performance

CPU, memory, pagefile, pressure indicators and top processes.

Identify current resource pressure.

Network

-Module Network

Adapters, IP, DNS, DHCP, routes, gateways, proxy and reachability.

Verify the actual traffic path and configuration.

Security

-Module Security

Defender, Firewall, Secure Boot, TPM and BitLocker.

Confirm the observable state of Windows protections.

Storage

-Module Disk

Physical disks, volumes, free space and warning thresholds.

Detect capacity pressure and relevant storage state.

Failures

-Module Crashes,Events

Crashes, hangs, BugChecks, Event Log evidence and dump metadata.

Collect recent failure evidence from multiple sources.

Services and startup

-Module Services

Services, startup entries and scheduled tasks.

Review execution and startup state.

Updates and time

-Module Updates,Time

Updates, pending reboot indicators and Windows Time state.

Detect conditions affecting deployment, authentication or behaviour.
Signal rules

Findings, not a log dump.

Every report opens with a findings summary. Severity is based on documented signal rules rather than the raw Windows event level alone.

How findings are classified →

Privacy Mode

Prepare reports for review.

Generate a report that can be attached to a ticket or shared with another engineer without exposing common host, user and network identifiers.

[x] Read-only
Collects state without changing Windows configuration.
[x] No telemetry
No tracking or remote collection endpoint.
[x] Auditable
Source, tests and security policy are public.

Collected

ComputerName : DESKTOP-4F1QK
UserName     : a.ivanov
IPv4Address  : 192.168.1.24
MacAddress   : B4-2E-99-0C-7A-11
DeviceId     : S-1-5-21-3402…

In the shared report

ComputerName : <HOST-1>
UserName     : <USER-1>
IPv4Address  : <IP-1>
MacAddress   : <MAC-1>
DeviceId     : <ID-1>

[!] Program names, dump-file names and Event Log messages can still contain sensitive information. Review every report before sharing it.

Incident guides.

Prepare a Windows diagnostic report for a support ticket.

Collect consistent evidence and review Privacy Mode output before attaching it.

Open guide →

Investigate high memory or CPU usage.

Compare current pressure, pagefile state and the highest-impact processes.

Open guide →

Collect application crash and hang evidence.

Review grouped Event Log, Reliability Monitor and dump metadata.

Open guide →

Verify network routes, DNS and proxy configuration.

Compare adapters, routes, gateways, name resolution and proxy state.

Open guide →

View all troubleshooting guides

FAQ

Operational details.

?Do I need administrator rights?

No for the standard collection. Some Windows sources expose less detail without elevation; WDT reports unavailable data and continues where possible.

?Does WDT change system configuration?

No. Production diagnostics collect and report state without changing services, registry settings, firewall rules or network configuration.

?Where are reports stored?

The interactive interface writes to .\WindowsDiagnosticsReports by default. Command-line mode writes to the current directory unless -OutputDirectory is provided.

?What does Privacy Mode remove?

It replaces common host, user, network and device identifiers with typed tokens. Program names, dump-file names and arbitrary sensitive Event Log text can remain.

?Does WARN mean the collection failed?

No. WARN identifies collected state worth reviewing. Module execution failures are reported separately and can produce a non-zero exit code.

Project review

Open source and reviewable

WDT is maintained by 0x0bug as an open-source Windows diagnostics project. Review the source, tests, security policy and release history before using it in a managed environment.

Collect the evidence before changing the system.

Run a consistent Windows diagnostic collection and move directly to analysis.
